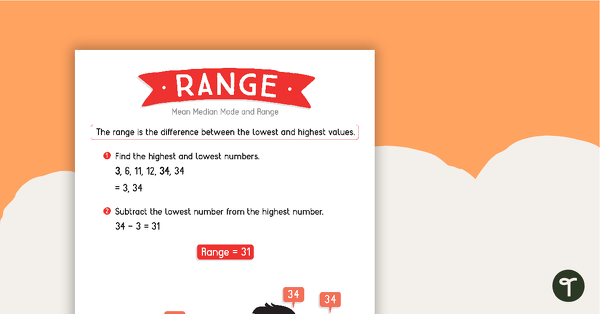
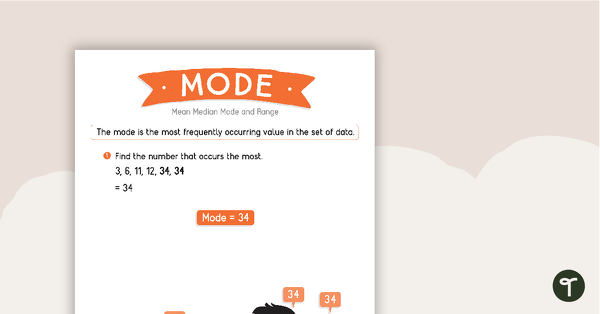
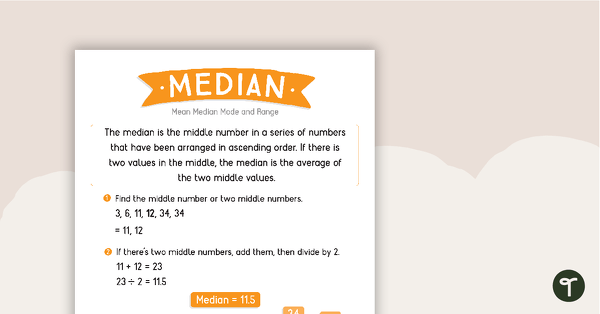
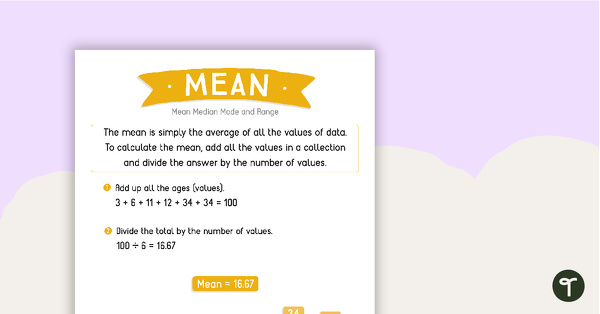
A set of posters to use when teaching numerical data summaries to your students.
Use these posters in your classroom when teaching the different types of numerical summaries to your students.
Updated: 16 Nov 2020
A set of posters to use when teaching numerical data summaries to your students.
Non-Editable: PDF
Pages: 4 Pages
Grades: 6 - 7
Tag #TeachStarter on Instagram for a chance to be featured!
A set of posters to use when teaching numerical data summaries to your students.
Use these posters in your classroom when teaching the different types of numerical summaries to your students.

We create premium quality, downloadable teaching resources for primary/elementary school teachers that make classrooms buzz!
Would you like something changed or customised on this resource? While our team makes every effort to complete change suggestions, we can't guarantee that every change will be completed.
Did you spot an error on this resource? Please let us know and we will fix it shortly.
Are you having trouble downloading or viewing this resource? Please try the following steps:
If you are still having difficulty, please visit the Teach Starter Help Desk or contact us .
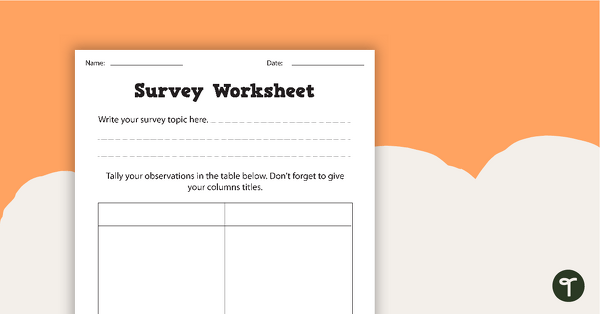
A set of worksheets for students to plan survey parameters and tally data.
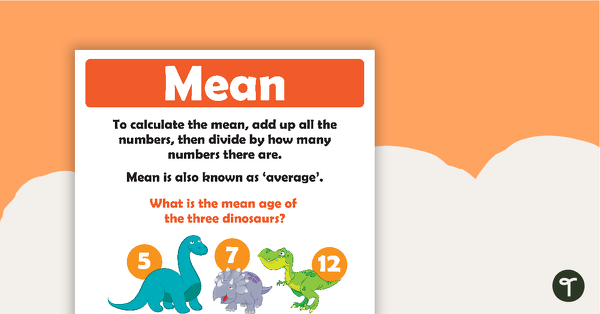
A set of two posters which clearly show how to calculate the average of a group of numbers.
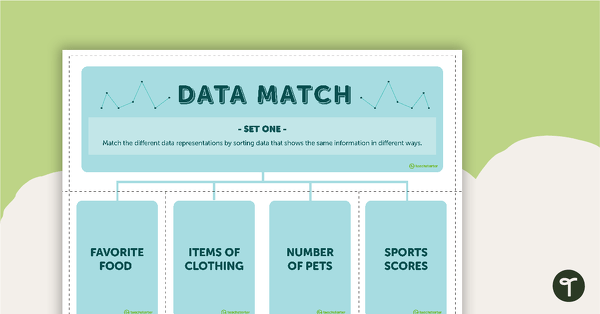
A match-up game for students to use when exploring data.
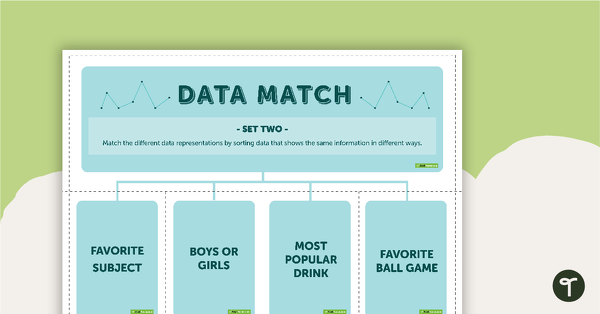
A match-up game for students to use when exploring data.
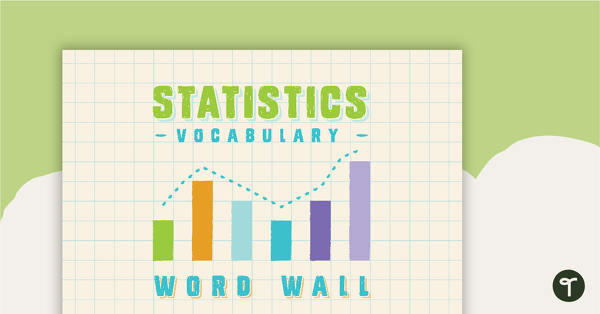
A comprehensive selection of statistics vocabulary for use on a Mathematics Word Wall.
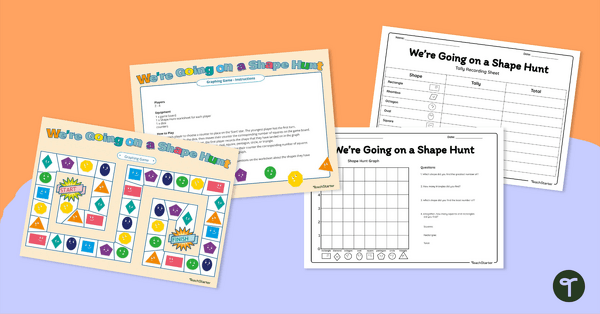
Consolidate students' knowledge of 2D shapes while teaching about data collection, recording and graphing!
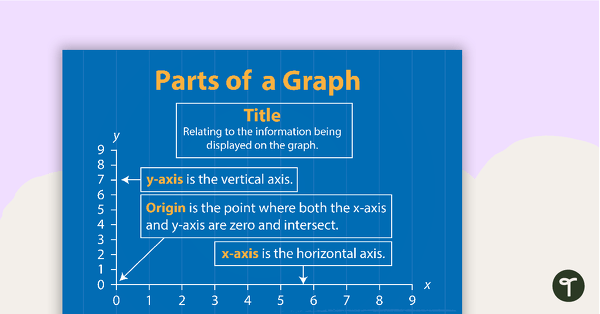
A poster showing the different parts of a graph.
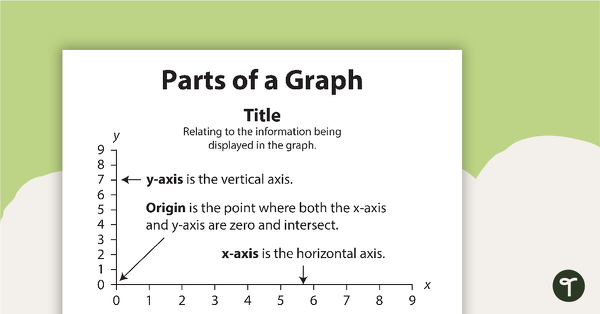
A poster showing the different parts of a graph.
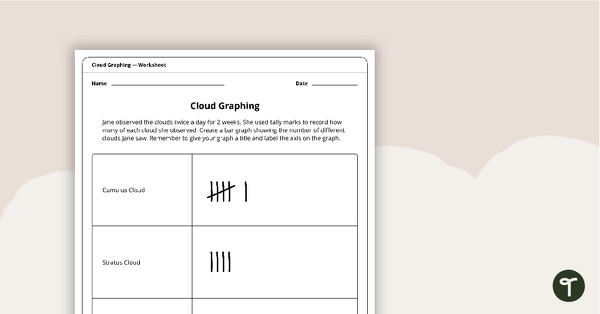
A worksheet to use when graphing cloud observations.
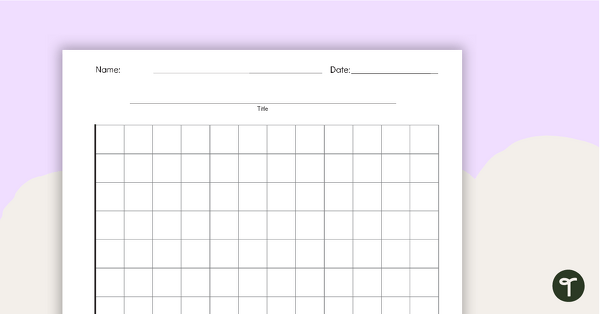
A blank template for constructing graphs.
0 Comments
Write a review to help other teachers and parents like yourself. If you'd like to request a change to this resource, or report an error, select the corresponding tab above.