Types of Graphs Teaching Resources
Teach your students the different types of graphs with printable graphing activities, worksheets, games and more data activities created by teachers for teachers like you!
Aligned with both TEKS and the Common Core math curriculum, the printables and digital activities in this collection can help you not just introduce each type of graph but also give your students practice using each one to represent and analyze data.
Whether it's your first year covering the various types of graphs in your math classes, or you're just looking for some handy tips and tricks, the Teach Starter teacher team has you covered. Read on for a primer that covers some of the main graph types plus a handy way to explain what a graph is to your students.
What Is a Graph? A Kid-Friendly Definition
Before you can start discussing the various graph types, it helps to explain what a graph is in math. That's where our definition could come in handy!
A graph is a visual way to show data. Graphs help make information easier to understand and analyze.
What Are the Different Types of Graphs?
There is a long list of different types of graphs that mathematicians use to represent numbers and other forms of data. So, which graph types do your students need to know about right now?
Let's take a look at the more common graphing types we use in elementary and middle school math classes:
1. Bar Graphs
A bar graph is a type of graph that uses rectangular shapes called bars to represent quantities or values of data. Bars on a bar graph will be different heights or different lengths to represent the quantity or value.
This makes it easy to compare the values.
2. Line Graphs
A line graph uses points that are connected by lines to show the relationship between two sets of data.
Line graphs are helpful when we want to see changes in data sets over a period of time.

3. Pictographs
The "picto" in pictographs refers to pictures, which are used in this graph type to represent data.
4. Pie Charts
Did you know that a graph is a kind of chart? Although pie charts may not be called "pie graphs," these circles divided by lines to resemble slices of pie are most definitely a type of graph.
Pie charts can be used to represent parts of a whole or categories of a whole, and they help us understand the proportion or percentage of each category.
- Free Plan
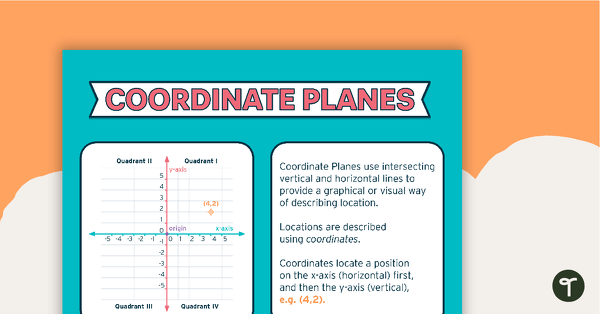
Coordinate Plane Poster
A poster that explains the features of Coordinate Planes.
- Plus Plan
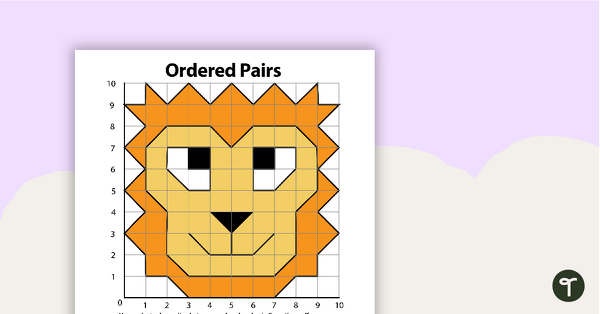
Drawing With Ordered Pairs - Lion
Students create a lion by plotting a set of ordered pairs.
- Plus Plan
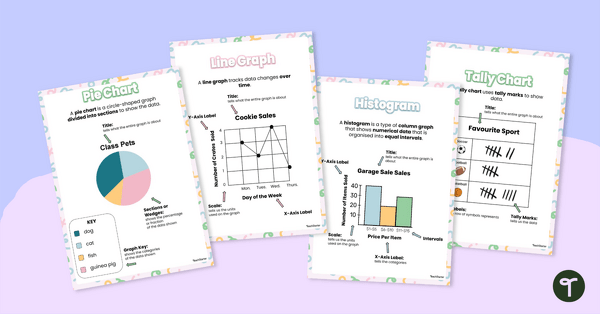
Types of Graphs Posters
This colorful and easy-to-digest visual display shows students the varying data displays they will encounter in their elementary math lessons.
- Plus Plan

Data Math Investigation - Should I Buy It?
Practice collecting and graphing data in a real-world situation.
- Plus Plan
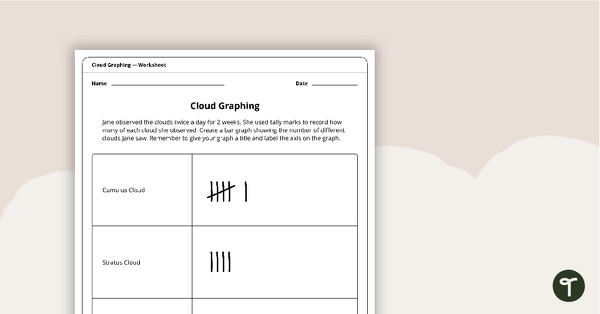
Cloud Graphing Activity
A worksheet to use when graphing cloud observations.
- Plus Plan
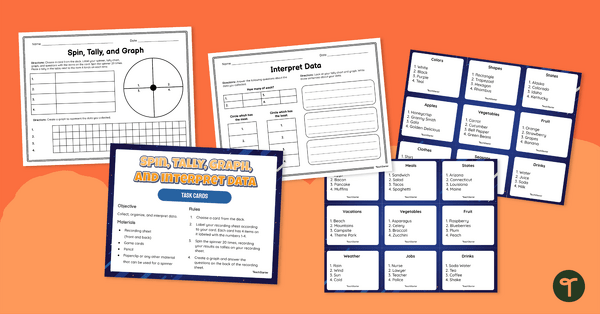
Spin, Tally, Graph and Interpret Data – Task Card Activity
Guide your students to collect data, make tally marks, create a bar graph and analyze data with this math activity designed for 1st and 2nd-grade students.
- Plus Plan
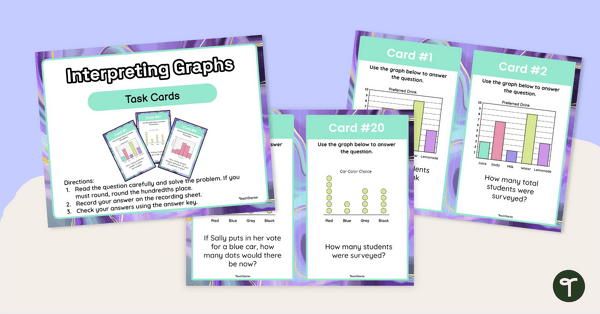
Interpreting Graphs Task Cards
Use this set of task cards students to practice interpreting bar graphs, histograms and line plots.
- Plus Plan
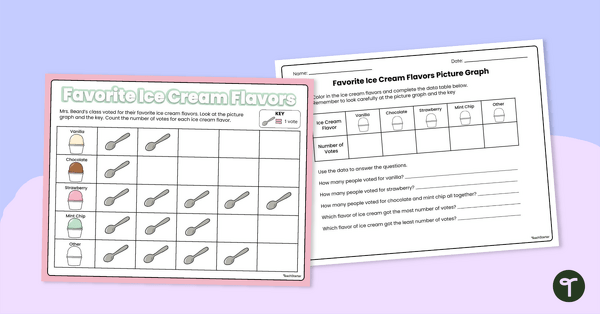
Picture Graphs - Worksheet
Use this double-sided worksheet to help your students practice reading and evaluating a simple picture graph.
- Plus Plan
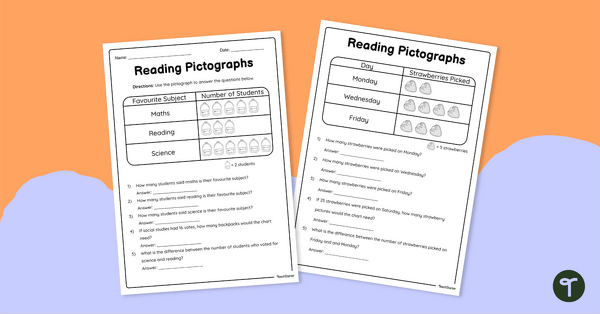
Reading Pictographs - Worksheets
Use this double-sided worksheet to enable students to practice reading and interpreting pictographs.
- Plus Plan
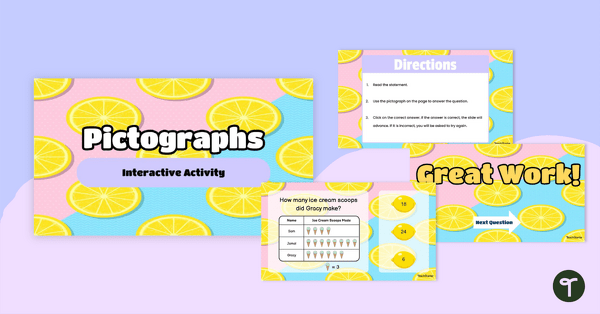
Pictographs - Interactive Activity
Use this fun and engaging interactive activity to aid students. in practicing their pictograph interpretation skills.
- Plus Plan
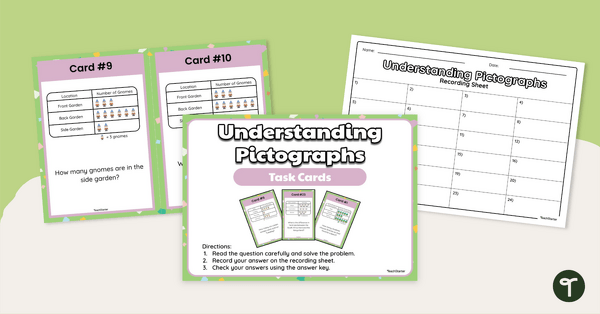
Understanding Pictographs - Task Cards
Use this set of task cards to practice reading and interpreting pictographs and bar graphs.
- Plus Plan
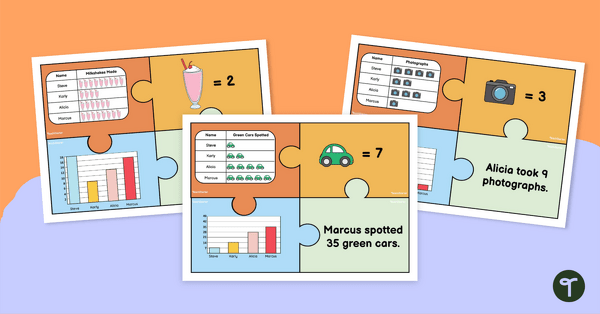
Pictograph Puzzles
Practice reading and interpreting pictographs with these fun puzzles which require students to match pictographs with other data displays with matching data.
- Plus Plan
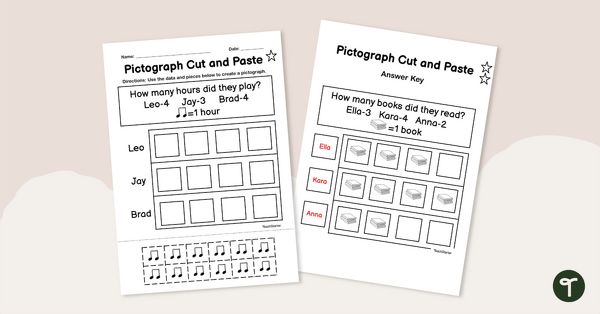
Pictograph Cut and Paste Worksheet
Use this fun cut-and-paste worksheet to build student understanding of pictographs and encourage them to practice their fine motor skills.
- Plus Plan
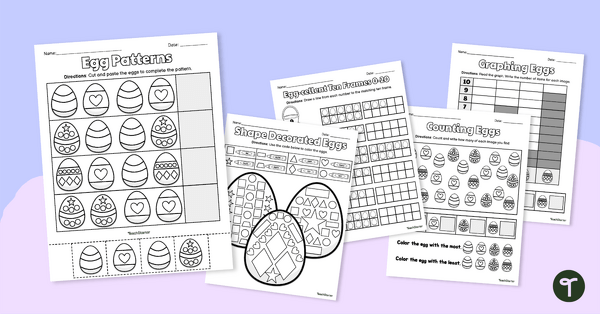
Kindergarten Math Review - Easter Worksheets
Practice various Kindergarten math concepts with a pack of Easter worksheets.
- Plus Plan
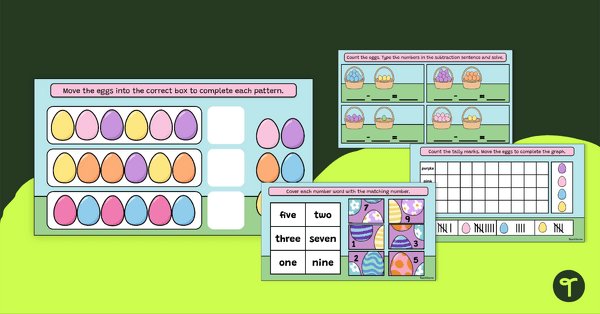
Easter Basket Digital Math Center
Save time lesson planning in the lead up to Easter with this Easter-themed Digital Math Activity.
- Plus Plan
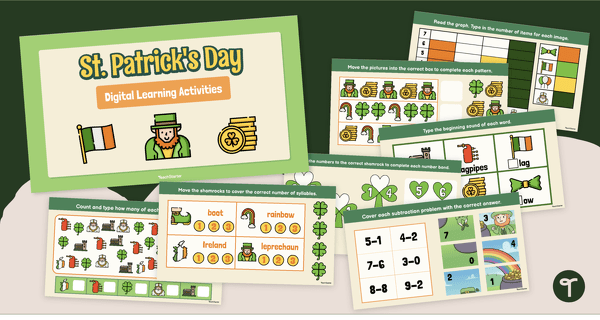
St. Patrick's Day Digital Centers
Celebrate St. Patrick’s Day with a digital math and literacy activity deck.
- Plus Plan
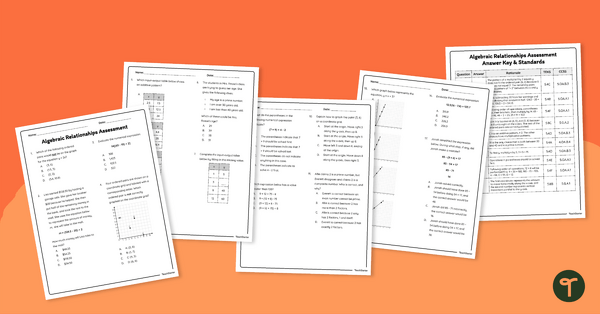
5th Grade Algebraic Relationships Assessment
Assess student understanding of prime and composite numbers, numerical expressions, graphing numerical patterns, and more with this math assessment.
- Plus Plan
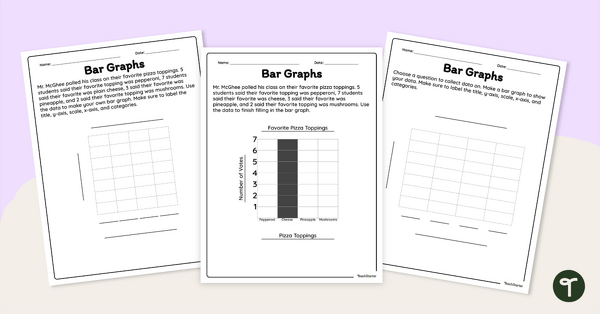
Creating a Bar Graph – Worksheet
Interpret data and create bar graphs with this worksheet.
- Plus Plan
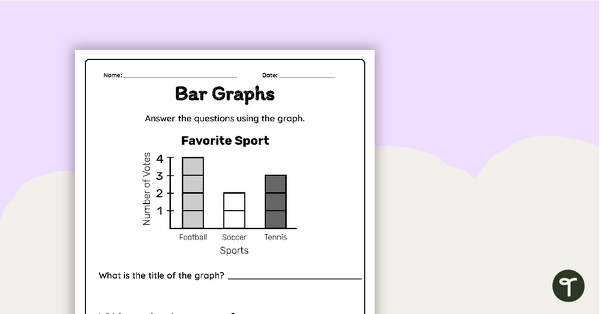
Interpreting a Bar Graph – Worksheet
Interpret information from a bar graph and answer questions with this worksheet.
- Plus Plan
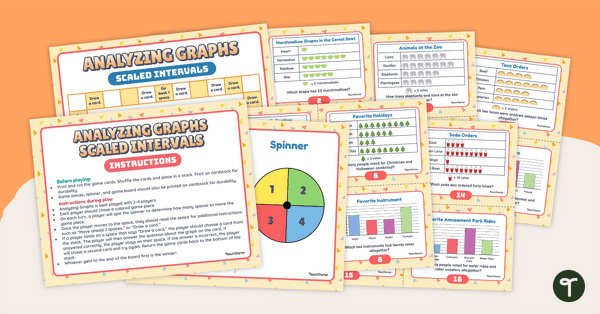
Analyzing Graphs (Scaled Intervals) – Board Game
Use this board game to sharpen data analysis skills when solving problems with information presented in a scaled picture graph and bar graph.
- Plus Plan
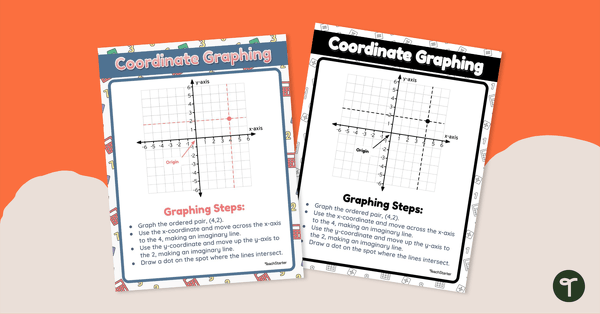
Coordinate Graphing Poster
Use this math reference sheet with your students when learning about coordinate graphing.
- Plus Plan
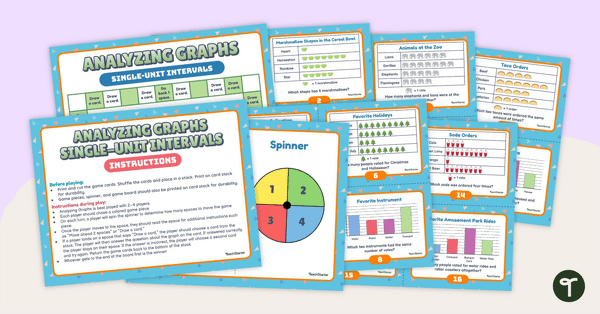
Analyzing Graphs (Single-Unit Intervals) – Board Game
Use this board game to sharpen data analysis skills when solving problems with information presented in a single-unit picture graph and bar graph.
- Plus Plan
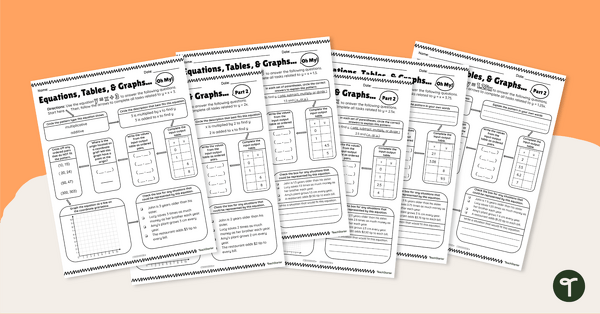
Equations, Tables, and Graphs, Oh My! – Differentiated Worksheets
Use these differentiated worksheets to practice using equations to create patterns within input-output tables and graphs.
- Plus Plan
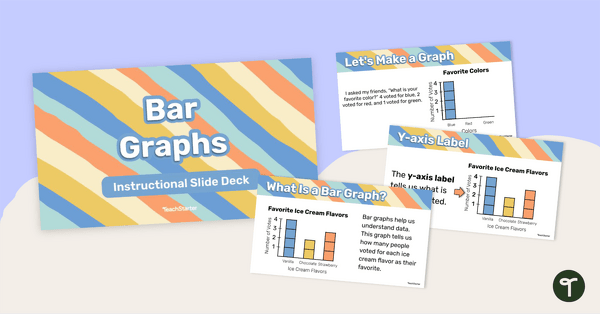
Bar Graphs – Instructional Slide Deck
Learn about the features and how to create a bar graph with this 25-page instructional slide deck.
- Plus Plan
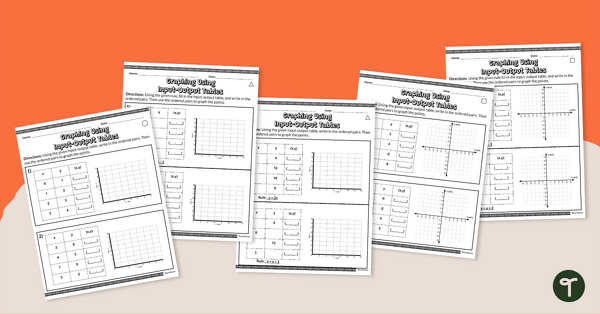
Graphing Using Input-Output Tables – Differentiated Worksheets
Use data from input-output tables to graph points with this set of differentiated worksheets.
- Plus Plan
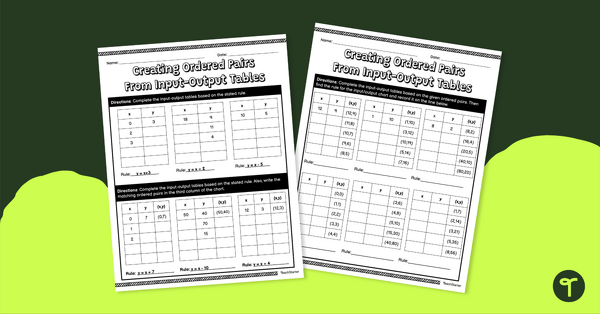
Creating Ordered Pairs From Input-Output Tables – Worksheet
Create ordered pairs from an input-output table and determine the rule for each table with this worksheet.
- Plus Plan
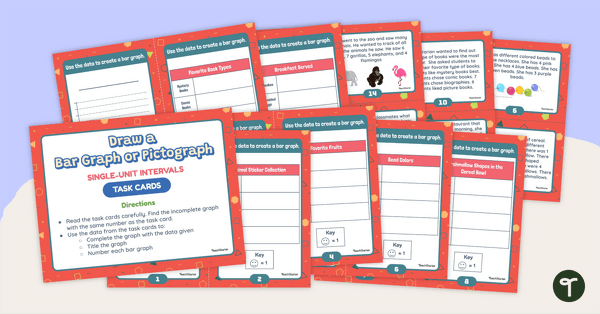
Draw a Bar Graph and Pictograph Task Cards (Single-Unit Intervals)
Practice drawing single-unit bar graphs and pictographs with this set of task cards.
- Plus Plan
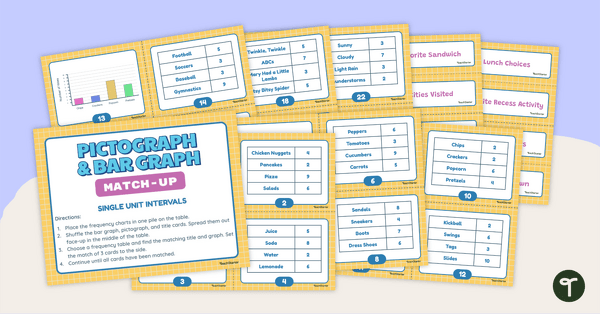
Pictograph and Bar Graph Match-Up (Single-Unit Intervals)
Use data analysis skills to match frequency tables with a corresponding bar graph or pictograph.
- Plus Plan
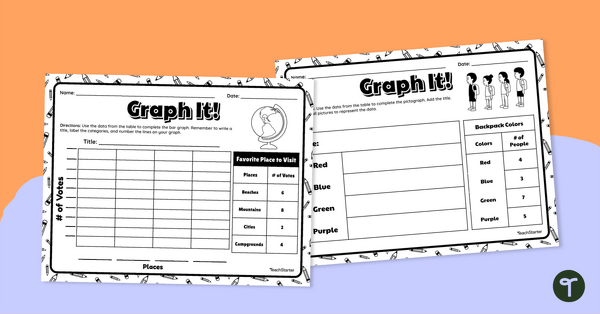
Graph It! Worksheet (Single-Unit Intervals)
Draw a single-unit picture graph and bar graph to represent data with this worksheet.
- Plus Plan
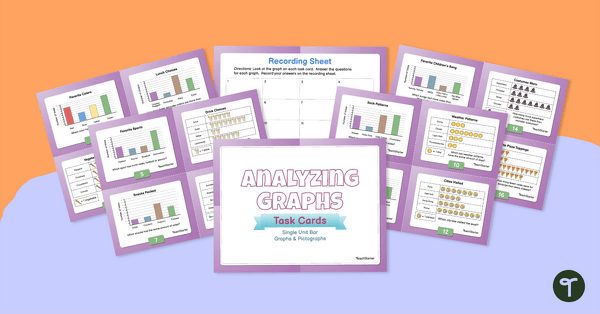
Analyzing Graphs – Single-Unit Bar Graphs & Pictographs – Task Cards
Use data analysis skills to analyze bar graphs and pictographs with this set of task cards.
- Plus Plan
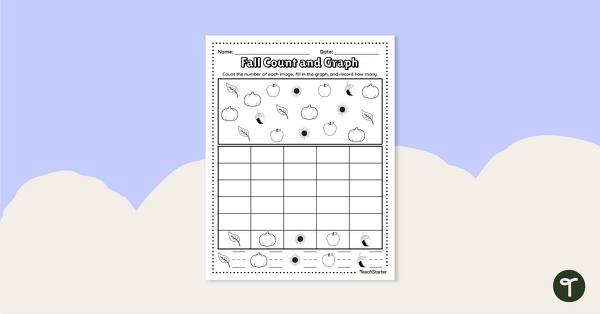
Fall Count and Graph Worksheet
Practice counting and graphing with a Fall-themed count and graph worksheet.
- Plus Plan
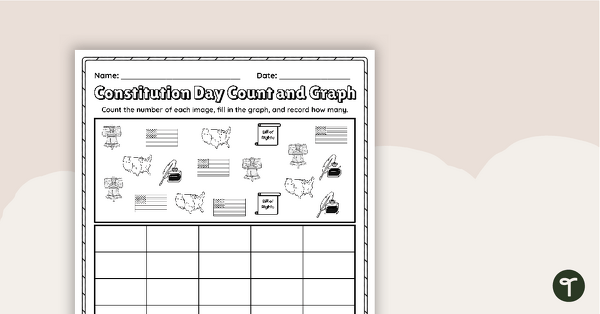
Constitution Day Count and Graph Worksheet
Practice counting and graphing with a Constitution Day themed worksheet.